Styles

Showing posts with label Big Data. Show all posts

Friday, November 25, 2022

Reporting on your After Hours in SnowFlake

My current work at Tyro is predominantly in the Snowflake Data Warehouse creating reports, building queries, and maintaining the DDL.

As such it is necessary to keep monitoring my constant usage as the team starts to grow and engineers become more accountable.

One good technique is to query the built-in view:
SNOWFLAKE.ACCOUNT_USAGE.QUERY_HISTORY
It consists of the USER_NAME, ROLE_NAME, and even the QUERY_TEXT of query that was run in snowflake.

What we need in order to find out the number of after hours worked on a day to day basis is the START_TIME of the query that was executed. With that we can then filter by any queries run after 5PM (i.e. the 17th hour of the day), and the difference between max and min dates for each day to find out how many hours were worked after that time.
SELECT
    USER_NAME,
    ROUND(TIMESTAMPDIFF('MINUTE', MIN(START_TIME), MAX(START_TIME)) / 60, 2) AFTER_HOURS,
    DAYNAME(MIN(START_TIME)) DAY,
    MIN(START_TIME) START_DATE,
    MAX(START_TIME) END_DATE
FROM SNOWFLAKE.ACCOUNT_USAGE.QUERY_HISTORY
WHERE USER_NAME = '<user_name>'
    AND DATE_PART('HOUR', START_TIME) > 17
GROUP BY
    USER_NAME,
    DATE_PART('DAY', START_TIME),
    DATE_PART('MONTH', START_TIME),
    DATE_PART('YEAR', START_TIME)
ORDER BY MIN(START_TIME) DESC;

Friday, December 10, 2021

Idempotency as a Process

From event streaming to datastore

Before delving into the subject matter, the first question to ask is what is idempotency? A quick Google search provides us with the mathematical definition which is also relevant in terms of the software concept.


The definition itself may be straightforward, however when a software solution involves consuming from an event stream and updating a record in a datastore, if idempotency is not considered as part of the development process, unexpected behaviours will certainly occur.

Implying that each event being consumed will only be processed once in a distributed system is a fallacy. A very simple example can show one of many causes for data inconsistencies.

Lets take a simplified example of storing an event stream's message into a relational database:

while (true) {
    var message = consumeEventMessage();
    db.upsertRecord(message);
    acknowledgeEventMessage(message.Id);
}

In this scenario, the database upsert could successfully complete and the subsequent acknowledgement of the message could fail which will result in a retrieval of the same message on the next run. If there is an aggregated field in the datastore, or a computation that occurs on-the-fly, the original data can be corrupted and result in erroneous data stored at rest. 

This wouldn't even be considered an edge case as it can happen more often than not. Network connections are never reliable and can drop out for a myriad of reasons. Building for failure and providing careful consideration for fault tolerance must be a part of any distributed system.

As an example, in a given scenario where a system needs to cater for A/B test campaigns, the typical process would be as follows:
  1. Set up an A/B test campaign to send to 1200 subscribers
  2. Configure email A with a subject A and send it to 100 subscribers
  3. Configure email B with a subject B and send it to 100 subscribers
  4. After an hour, send the remaining 1000 subscribers to the email with the highest open rate
From an event streaming perspective this is relatively straightforward:
publish message { id: 1, email: 'A', subject: 'A', sent: 100, date: '2021-12-01 12:00:00' }
publish message { id: 2, email: 'B', subject: 'B', sent: 100, date: '2021-12-01 12:00:00' }
publish message { id: 1, email: 'A', subject: 'A', sent: 1000, date: '2021-12-01 13:00:00' }
Storing this into a normalised relational database table wouldn't be so difficult either:

id email subject date sent
1 A A 2021-12-01 12:00:00 100
2 B B 2021-12-01 12:00:00 100

Now with the upsert implementation db.upsertRecord(message) we can achieve parity with the total number of subscribers:

id email subject date sent
1 A A 2021-12-01 13:00:00 1100
2 B B 2021-12-01 12:00:00 100

In an ideal distributed world, this would work. But immediately we can see issues. The obvious one is the loss of data overwritten by the upsert, namely the initial sent date of the A/B test for email A. Another concern would be the fact that we seem to be calculating the total for a specific record on-the-fly and updating the sent count. The other issue isn't glaringly obvious unless a failure occurs in acknowledging the message as was mentioned above. If acknowledgeEventMessage(message.Id) is invoked for the third message and fails, we could get the following state after a retry:

id email subject date sent
1 A A 2021-12-01 13:00:00 2100
2 B B 2021-12-01 12:00:00 100

What is worse is that we have no way of undoing this unless we clear the database entirely and replay the entire event stream (or at a checkpoint) which would add a lot of development hours and maintenance overhead to resolve the issue.

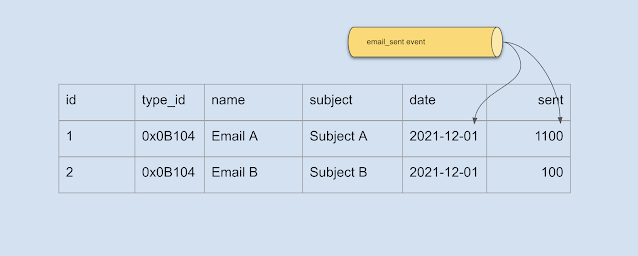
In order to make the system idempotent for either the case of failure or a scenario where event streams would be replayed on existing data, the original data needs to be persisted in such a way that would still benefit the normalised state of the relational database table. The following schema can help achieve this:

id email sub date_1 sent_1 date_2 sent_2 computed
1 A A ...12:00 100 ...13:00 1000 1100
2 B B ...12:00 100 (null) (null) 100

A change in table structure can help alleviate the problems of duplicate messages being consumed. It also enables persisting original data in order to avoid data loss. The unfortunate side effect however is that some records will not utilize all the data fields and will inevitably contain null values and that could be a deal breaker for the purists. Perhaps even normalizing the database table further into two separate tables with a one-to-many relationship would suffice, but that depends entirely on the volume of records and query efficiency surrounding the total sent count.

Moreover, events could be consumed out of order because there is no guarantee of order unless messages are consumed from the same partition. The above solution would still cater for this anomaly if sent_1 was 1000 and sent_2 was 100, and therefore our idempotent implementation is fulfilled.
Monday, June 13, 2016

Don't Always Believe Your Data

As erroneous as that statement might seem, not trusting your data might be the most prudent thing you do. In this new age of data-driven development where data has become a precious commodity, the need to unlock valuable information that businesses hold about customer interactions has become a crucial part of business success, and hence the investment for better ways to store and extract data has evolved over the last few years more than it ever had over the previous two decades.

The options are endless now with experts recommending vast arrays of strategies to tackle your storage and analysis techniques. But it is more than just the sum of all knowledge about these alternatives that makes you a Data Scientist. The reason we store data in the first place is to provide information that can remove ambiguity in our decision making process. That requires a broader outlook towards investigating industry trends and changes in technology on top of our expertise on how well we persist and describe our business data.

There was a time when relational data stores ruled the earth and with them came the ability to analyse large amounts of data using OLAP cubes. But as the need grew for a more efficient Extract Transform Load (ETL) process the limitations became obvious. Analyzing records that were aggregated nightly because there was “too much data” to extract no longer became a legitimate excuse. Businesses want it now, and they want a lot of it.

With that, storage capabilities evolved to scale horizontally with the map-reduce patterns of document stores like Mongo, key-value stores like Riak, graph stores like Neo4j, and columnar stores like Cassandra. Add into the mix the likes of Big Data storage such as Hadoop, and Event Streams for real time processing like kafka and Amazon Kinesis. Although competition is always a welcome dynamic in any industry, with every contender vying for feature capabilities over their competitors, the choice becomes difficult.

Storage is just one part of the puzzle however. Next would come analysis and forecast. Once a business makes sense of the data it holds with a myriad of techniques for analysis, predicting change comes packaged for us with Machine Learning. Apache Spark jumped on this wagon early commercially with its MLlib offering and Google has also been a popular choice with TensorFlow. There is a degree of expertise required in handling these tools including understanding the type of learning you want your machine to perform, whether its supervised learning using labeled datasets (for fraud detection and recommendations), unsupervised and semi-supervised learning with unlabeled datasets (for image and voice recognition), or reinforcement learning (for artificial intelligence).

There is more to it than knowing your alternatives though. Your data can only tell you as much information as your business keeps about itself, and so Data Science is not just about how to unlock your data with the available tools, its about causation. It's about why.

Identifying peaks or troughs in a graph might help you determine with a guarantee that your tools can help you see patterns or changes, but not the reasons why these patterns and changes exist. And thus starts the real investigation.

This was a lesson that Andrea Burbank from Pinterest learnt as she explained at the YOW! Conference held in Sydney late 2016, and she was kind enough to share her challenges in trying to successfully formulate behavioral trends from Pinterest's massive data storage. The results of her findings were very interesting.

By measuring "daily active users", Pinterest were able to determine which unique customers engaged on their site. Using kafka, they were able to stream logs of response data that told the user's story, but that was just basic counting.

In late October of 2013, they found a sudden step change in growth rate specifically with iPhone users, which seemed likely to be the result of Pinterest being featured in the App Store. What they found though was that it was merely a coincidence because not long before a new feature was introduced to iOS 7 called "Background App Refresh" to prevent apps hanging in suspended animation.

Burbank realized that the statistics they generated weren't telling the full story and after digging further found that one of their endpoints, particularly the home feed endpoint, was giving unnatural background hits even when the app wasn't appearing in the multitask tray, and that obviously had no correlation to daily active users.

This lead to what Burbank defined as the "Spectrum of Certainty" where correlation is found at one end of the spectrum while causation is found at the other. Most of the time Data Scientists believe they are closer to the causation end of the spectrum, when in actual fact they sit very close to the correlation side.

The goal is to ensure data analysis moves towards causal inference, in effect requiring much more investigative techniques about events that occur outside the business domain which may have a strong impact on how data is represented within the business itself. Only then can you truly believe your data to a certain degree.

Reference: Data science as software, Andrea Burbank, Pinterest, YOW! Conference 2016 Sydney